Vector data for Entity-based modelling
Vector data for Field-based modelling
Triangular Irregular Network (TIN)
A Triangular Irregular Network (TIN) is a fundamental data structure in Geographic Information Systems (GIS) used to represent continuous surfaces, such as elevation, bathymetry, or even phenomena like temperature or pollution concentration. Unlike grid-based models (rasters), which typically use regularly spaced cells, a TIN is built from a set of irregularly distributed points, each with an associated (x, y, z) value (e.g., longitude, latitude, elevation).
The core idea of a TIN is to connect these input points into a network of non-overlapping triangles, forming a continuous, three-dimensional surface. This triangulation process often employs algorithms like Delaunay triangulation, which ensures that no point lies inside the circumcircle of any triangle. This property generally produces “well-conditioned” (as equilateral as possible) triangles, avoiding long, skinny triangles that can lead to interpolation errors.
Key Characteristics and Advantages:
-
Irregularity and Adaptive Resolution: The “irregular” nature is key. TINs can adapt their resolution to the complexity of the terrain. In areas with significant topographic variation (e.g., mountain peaks, valleys), the input points can be denser, resulting in smaller, more numerous triangles. In flatter, more homogeneous areas, points can be sparser, leading to larger triangles. This makes TINs particularly efficient for representing rugged or complex surfaces, as they use fewer points and triangles than a raster might require to capture the same level of detail, especially when detail is not uniform across the surface.
-
Vertex-Based Attributes: In a TIN, the primary attribute (
zvalue) is associated with the vertices (the input points) that form the corners of the triangles. The surface within each triangle is then typically interpolated linearly from thezvalues of its three vertices, creating a planar facet. This contrasts with rasters, where a single attribute value is typically associated with the entire cell or pixel.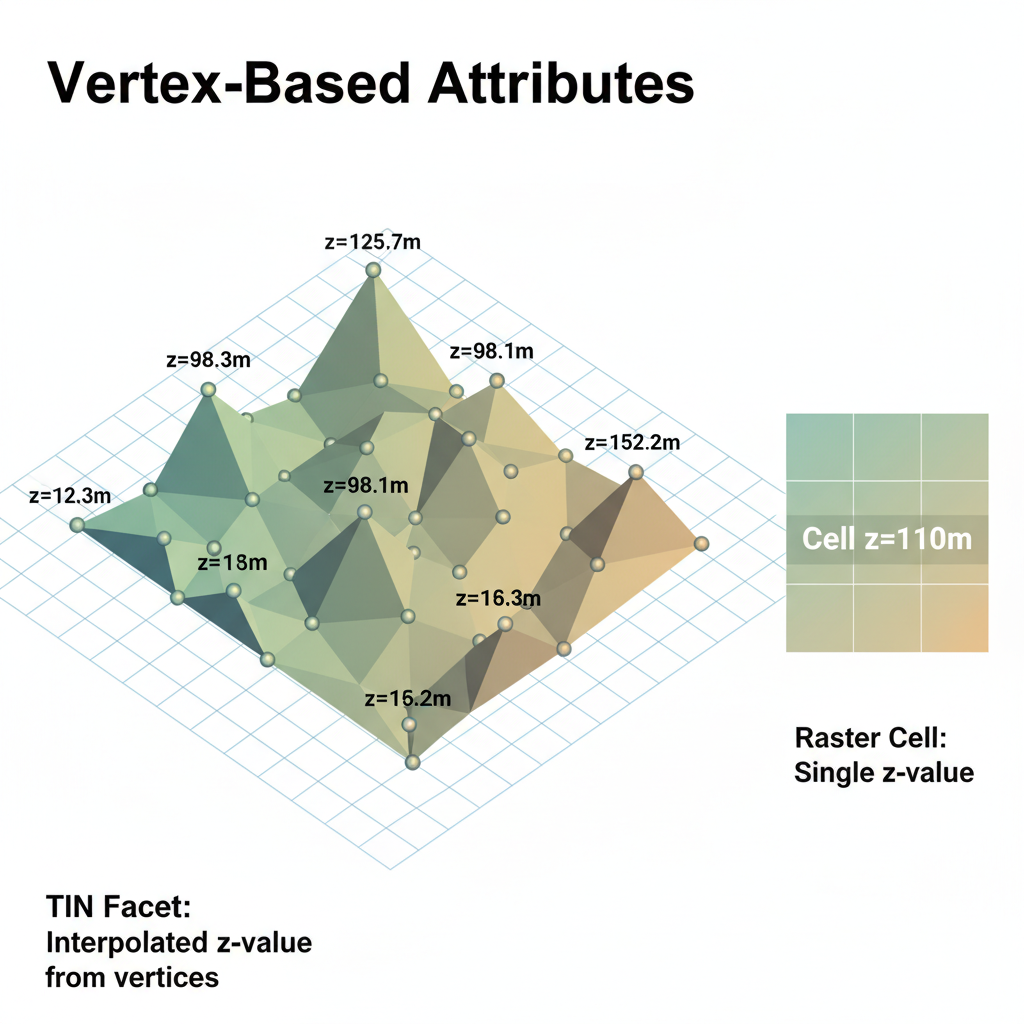
-
Preservation of Original Points and Edges: TINs can precisely preserve the location and elevation of significant features, such as peaks, pits, ridges, and breaklines (e.g., cliff edges, stream beds) by incorporating them directly as input points or enforced edges in the triangulation. This makes them excellent for engineering applications where exact feature representation is critical.
-
Spatial Relationships: TINs explicitly define topological relationships between points, edges, and faces (triangles), which can be advantageous for certain spatial analyses, such as watershed delineation or visibility analysis.
Contrast with Raster Digital Elevation Models (DEMs):
While both TINs and raster DFMs represent surfaces, their underlying data structures and typical use cases differ:
-
Data Structure:
-
TIN: Vector data model, storing points and their topological relationships.
-
Raster: Grid data model, storing attribute values in regularly spaced cells.
-
-
Resolution:
-
TIN: Variable resolution; denser where complexity requires, sparser elsewhere.
-
Raster: Fixed resolution; every cell is the same size, regardless of terrain complexity.
-
-
Storage Efficiency:
-
TIN: Can be more efficient for complex, non-uniform surfaces if precision isn’t needed everywhere.
-
Raster: Often more efficient for uniform, very detailed surfaces or when regular grid-based analysis is primary.
-
-
Surface Representation:
-
TIN: Triangles are typically planar facets, allowing for precise breaklines. The surface is continuous but not necessarily smooth across triangle boundaries without further interpolation.
-
Raster: Surface is represented by discrete steps (cell values). Smoothing often applied during generation or visualization.
-
-
Typical Applications:
-
TIN: Engineering, precise terrain modeling, hydrological modeling where breaklines are critical, visualization requiring detailed facets.
-
Raster: Regional elevation analysis, viewshed analysis, slope/aspect calculation, input for hydrological models where flow accumulation is key.
-
In essence, TINs offer a powerful, flexible, and often more precise way to model surfaces, particularly when the distribution of sample data is irregular or when the accurate representation of specific terrain features (like ridges and valleys) is paramount. They highlight the diverse approaches GIS takes to represent our three-dimensional world.