Modifiable areal unit problem (MAUP)
When point data are aggregated to areas, the result depends on the areas chosen. The same dwellings, people or observations give different values, different patterns and different conclusions when they are summarised by districts, by neighbourhoods or by a grid. This dependence is the modifiable areal unit problem: modifiable because the areas could have been drawn otherwise, and a problem because the analysis rarely says so.
Related: Aggregating points to zones (Task), Aggregation (Operator family). Worked example: Share of rented dwellings in Copenhagen (Example).
Two effects
- The scale effect: smaller areas give a wider spread of values. Large areas average out differences, so a few districts look alike and many small areas do not.
- The zoning effect: areas of the same size but with different borders give different results. Moving a grid by half a cell, or redrawing districts, changes the values without changing the data.
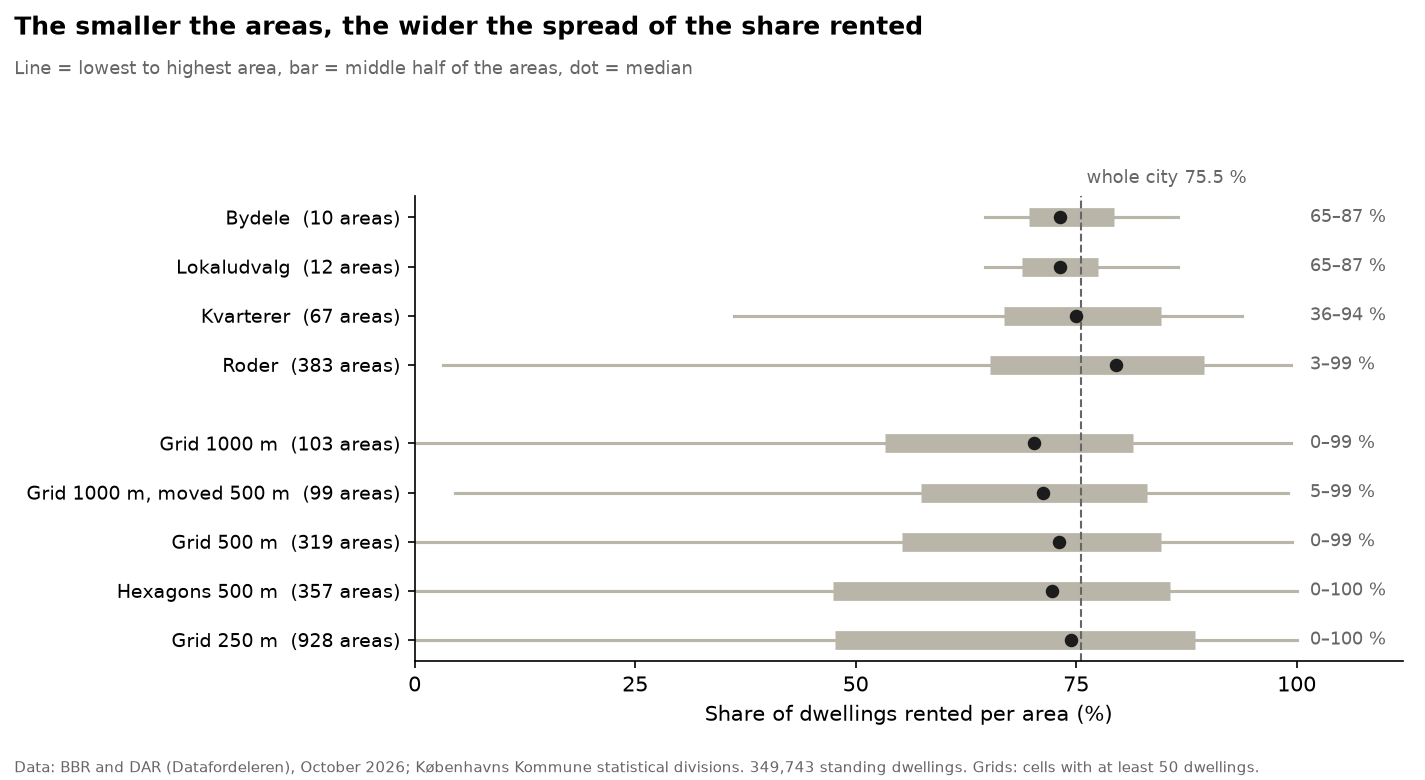
In Copenhagen the share of dwellings that are rented is 75.5 % for the city as a whole. Across 10 districts (bydele) it ranges from 65 to 87 %, across 400 roder from 3 to 99 %, and across 250 m grid cells from 0 to 100 %. The standard deviation of the shares rises from 0.07 for bydele to 0.13 for kvarterer, 0.19 for roder and 0.30 for 250 m cells. Moving the 1,000 m grid by 500 m changes the number of cells with at least 50 dwellings from 103 to 99 and the lowest share from 0 to 5 %.
Never average averages upwards
Counts and sums can be added from small areas to a larger area that contains them. Means, shares, medians and densities cannot. A plain mean of the small areas’ values gives every area the same weight, whether it holds 50 dwellings or 2,000.
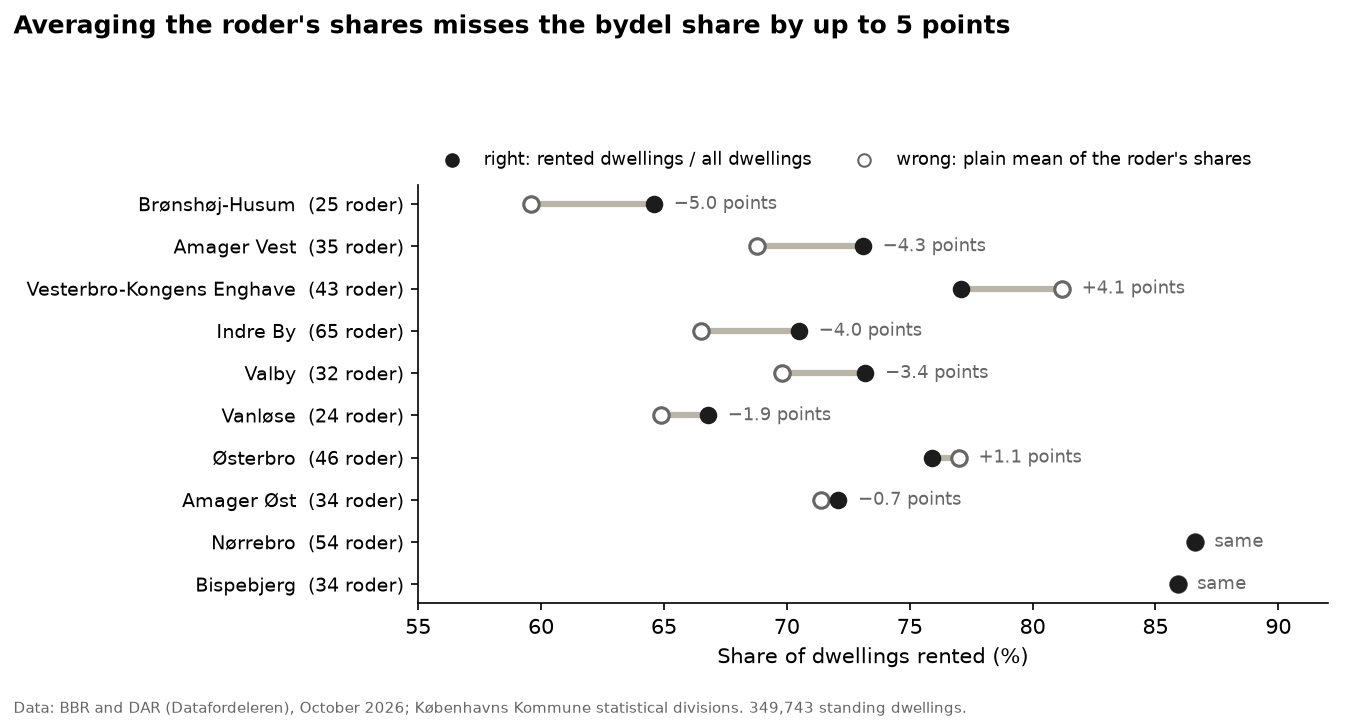
The roder fit exactly inside the bydele, yet averaging the roder’s shares gives the wrong bydel share in eight of ten bydele, by up to 5 points (Brønshøj-Husum: 59.6 % instead of 64.6 %). For the whole city the mean of the roder shares is 74.2 % against the true 75.5 %.
Do it this way instead:
- Shares and means: add up the parts and divide again: share rented in a bydel = the sum of rented dwellings over its roder / the sum of all dwellings over its roder.
- Densities: add up the counts and add up the areas, then divide.
- Medians and other percentiles: they cannot be built from the parts; aggregate the points again.
The ecological fallacy
An area’s value describes the area, not the people or dwellings in it. A neighbourhood with 50 % rented dwellings can be a mix of rented and owned buildings, or two homogeneous halves. Reading individual behaviour off area averages is the ecological fallacy.
What to do about it
- Say which areas a map uses, and why they fit the question.
- Try a second set of areas, or a grid, before drawing conclusions; a pattern that survives a change of areas is a stronger finding.
- Show areas with too few observations as such, rather than as values.
- Treat a kernel density as no escape: its radius plays the role the areas played, and a small radius and a large one give two different cities.