Vegetation greenness at Ledreborg — Example
A worked case for remote sensing with Sentinel-2 in QGIS. Companions: Habitat network at Ledreborg (Example), Soil carbon and land use at Ledreborg (Example). Theory: Remote sensing.
In mid-June almost all of Ledreborg is green to a satellite: three quarters of the study area has an NDVI above 0.8. Forest (0.90) and intensively farmed fields (0.85) are nearly alike, because NDVI saturates over dense vegetation. The colour-infrared image of the same date still tells them apart. Lower values mark what is not closed vegetation: villages (0.66), paved roads (0.54) and extensively farmed land (0.76).
Example data
- Sentinel-2: download it yourself with the Copernicus Browser: Sentinel-2 L2A, 14 June 2025 (Sentinel-2C, tile 32UPG, 0.01 % cloud), bands B02, B03, B04, B08 and SCL for the study area, as in Vegetation index from Sentinel-2 (Recipe - QGIS).
- Study area and land use: ledreborg_example_data.zip, a snapshot package with the Basemap04 land use (10 m) and its class list.
1. Spatial Intent
Question: how green is the vegetation of the Ledreborg study area at the height of the growing season, and how does it differ between land uses?
Study area: the Ledreborg estate, 680077, 6165317 : 686782, 6170607 (EPSG:25832), 6.7 × 5.3 km.
Units of observation: 10 m Sentinel-2 pixels; units of presentation: the pixels as a map, and Basemap04 land-use classes as a table.
2. Auditing the data
| Data | Source | What it is | Choices |
|---|---|---|---|
| Red, NIR, blue, green | Sentinel-2 L2A (ESA), 14 June 2025, 10:25 UTC | surface reflectance, 10 m | a cloud-free date in the growing season; L2A, not L1C |
| Scene classification | Sentinel-2 L2A SCL, 20 m | automatic class per pixel | classes 4, 5 and 6 kept; 2 (dark) and 7 (unclassified) masked |
| Land use | Basemap04, lu_agg_2021 (10 m) | 35 aggregated classes, 2021 | resampled to the Sentinel-2 grid by majority |
What the data cannot say:
- The image shows one morning. The fields’ NDVI depends on the crop and its stage on that day; a week later or in another year it is different.
- The scene classification found no cloud or cloud shadow over the area; it marks 2.4 ha as water, where Basemap04 has 85 ha of lakes. Most of those lakes are small, and their 10 m pixels are partly vegetation.
- Land use is from 2021, the image from 2025.
3. The Analytical Schema
flowchart LR
  I[Choose and download the image] --> N[Vegetation index]
  N --> Z[Zonal summary per land use]
  LU[Basemap04 land use] --> Z
| Task | Recipe | Operator families used |
|---|---|---|
| Vegetation index from satellite imagery (Task) | Vegetation index from Sentinel-2 (Recipe - QGIS) | Selection, Conversion and data management, Attribute calculation |
| Aggregating a continuous raster to zones (Task) | Aggregating a continuous raster to zones (Recipe - QGIS) | Aggregation |
Settings used
- Image: Sentinel-2 L2A, 14 June 2025 (Sentinel-2C, tile 32UPG), B02, B03, B04, B08 and SCL, 10 m, cut to the study area. The numbers below were computed from the same product read from its public copy on AWS (Earth Search) and resampled to the 10 m grid of the other Ledreborg data in EPSG:25832; a download from the Copernicus Browser can differ in the second decimal from resampling.
- NDVI (Vegetation index from Sentinel-2 (Recipe - QGIS)):
( ("B08@1" - "B04@1") / ("B08@1" + "B04@1") ) / ( "SCL@1" = 4 OR "SCL@1" = 5 OR "SCL@1" = 6 ). - Composites: true colour B4, B3, B2; colour infrared B8, B4, B3; each band stretched between its 2nd and 98th percentile.
- NDVI per land use (Aggregating a continuous raster to zones (Recipe - QGIS)): Raster layer zonal statistics with
lu_agg_2021resampled to the NDVI grid as zones.
4. Results
The image
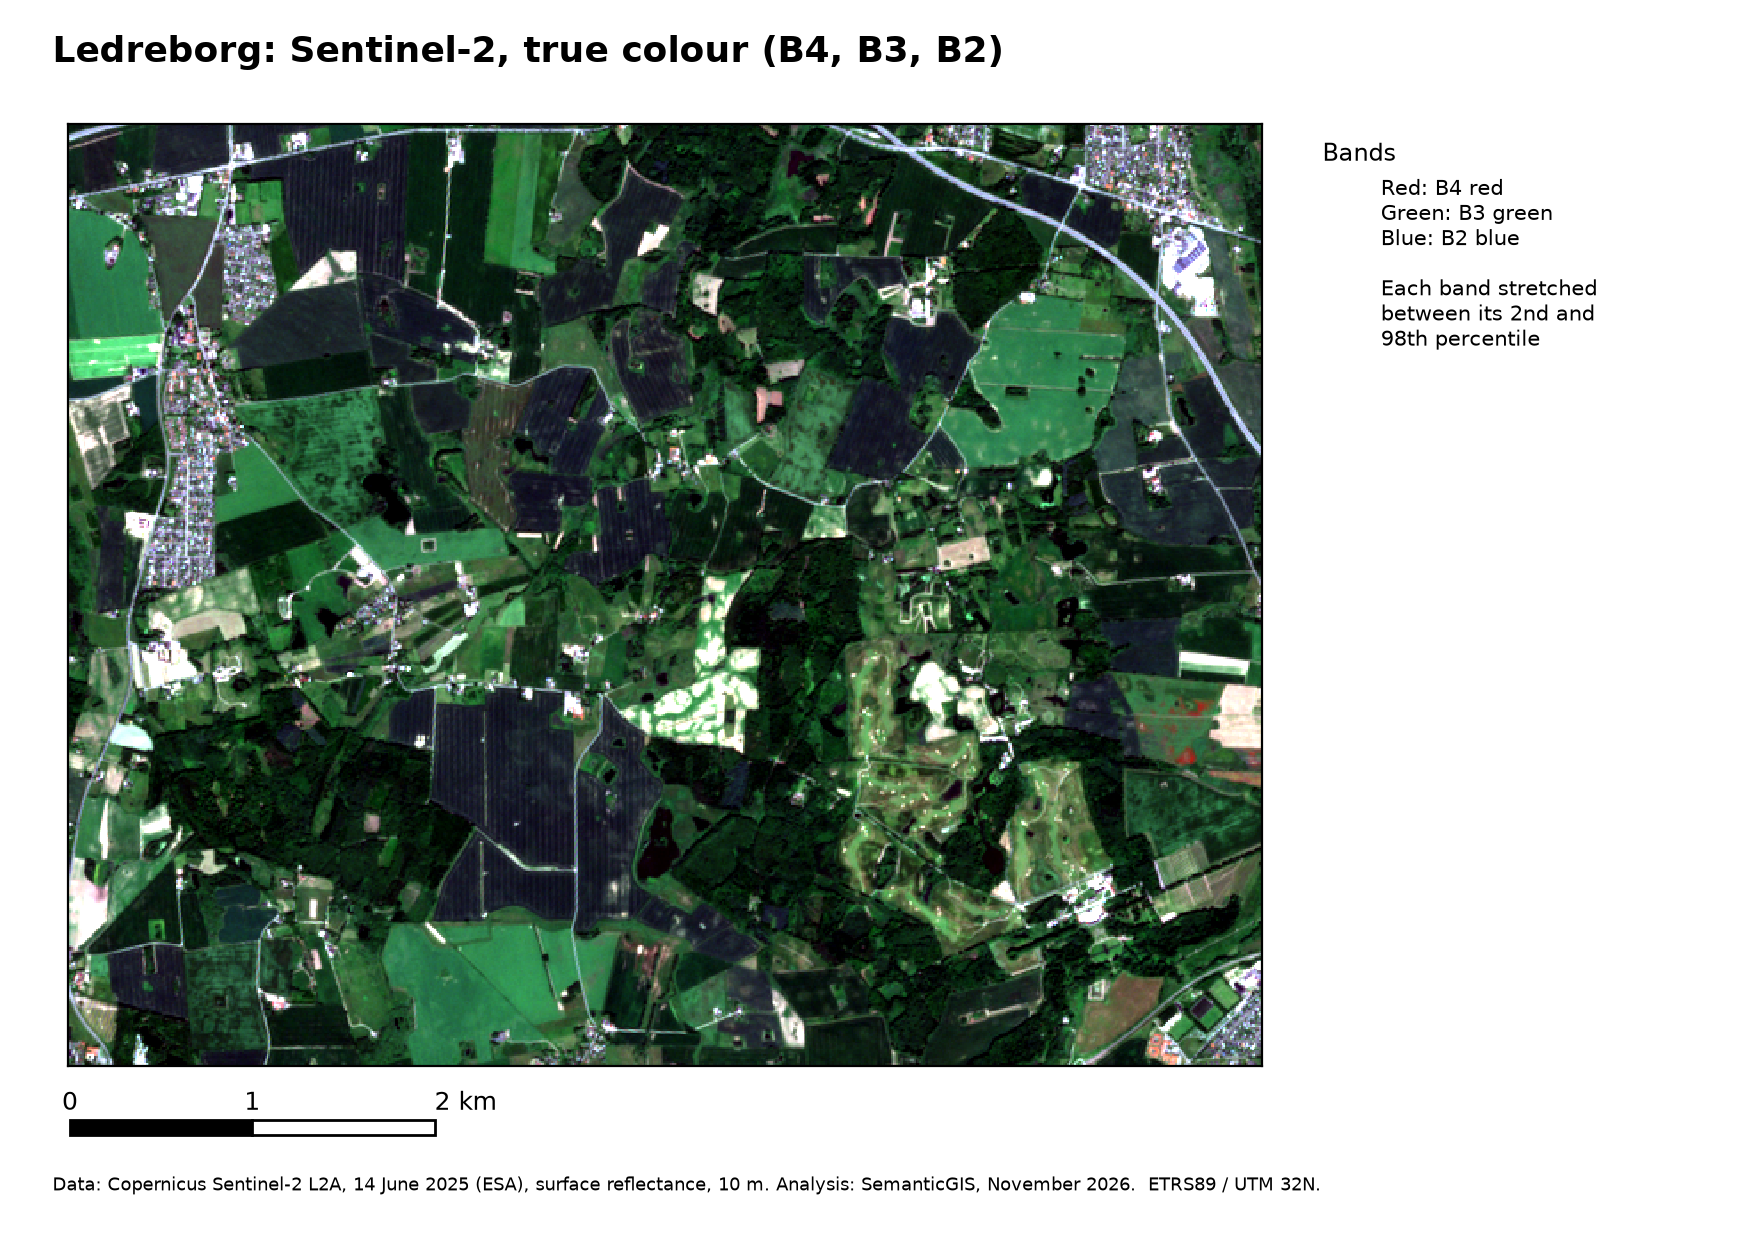
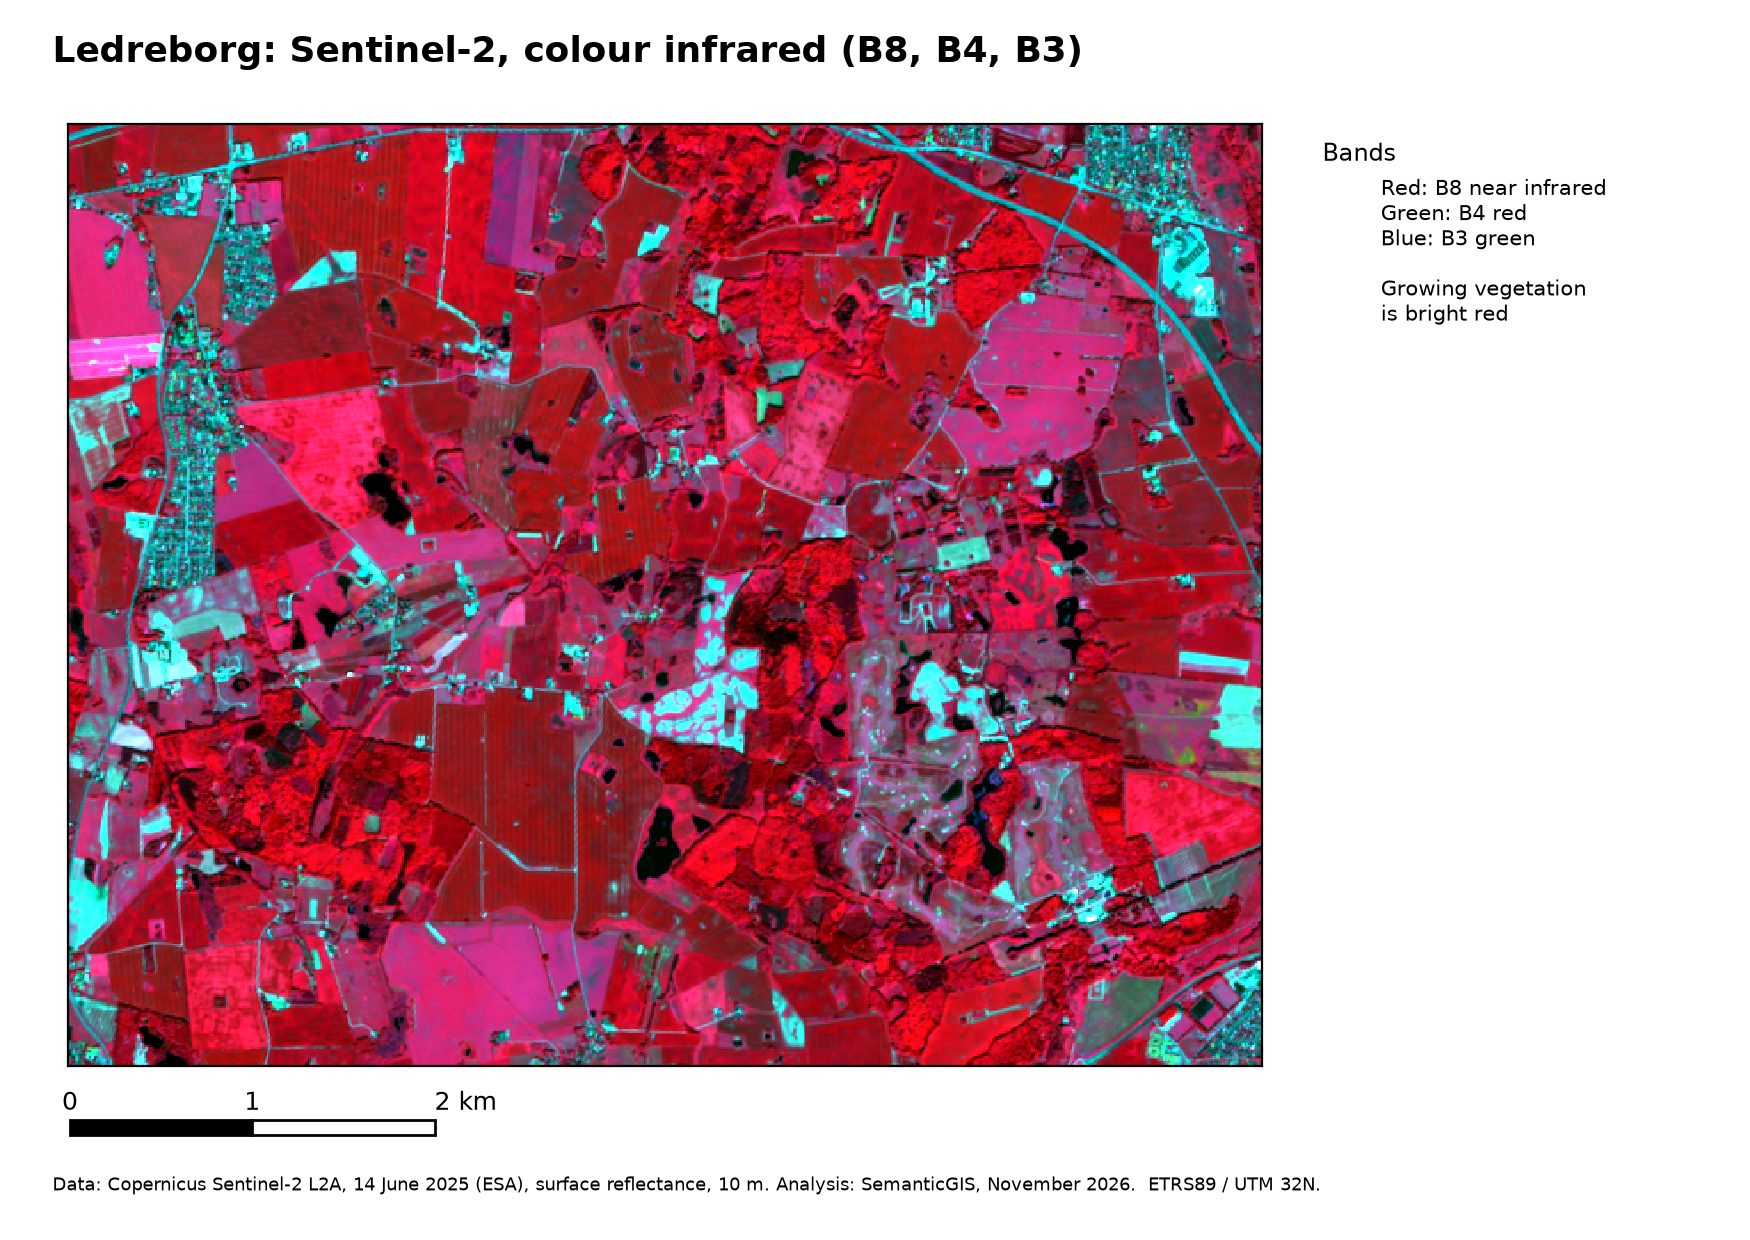
In true colour almost everything is a similar green. In colour infrared the forests are dark, textured red, the fields smooth red or pink depending on the crop, villages, roads and bare ground cyan to white, and the lakes black.
NDVI
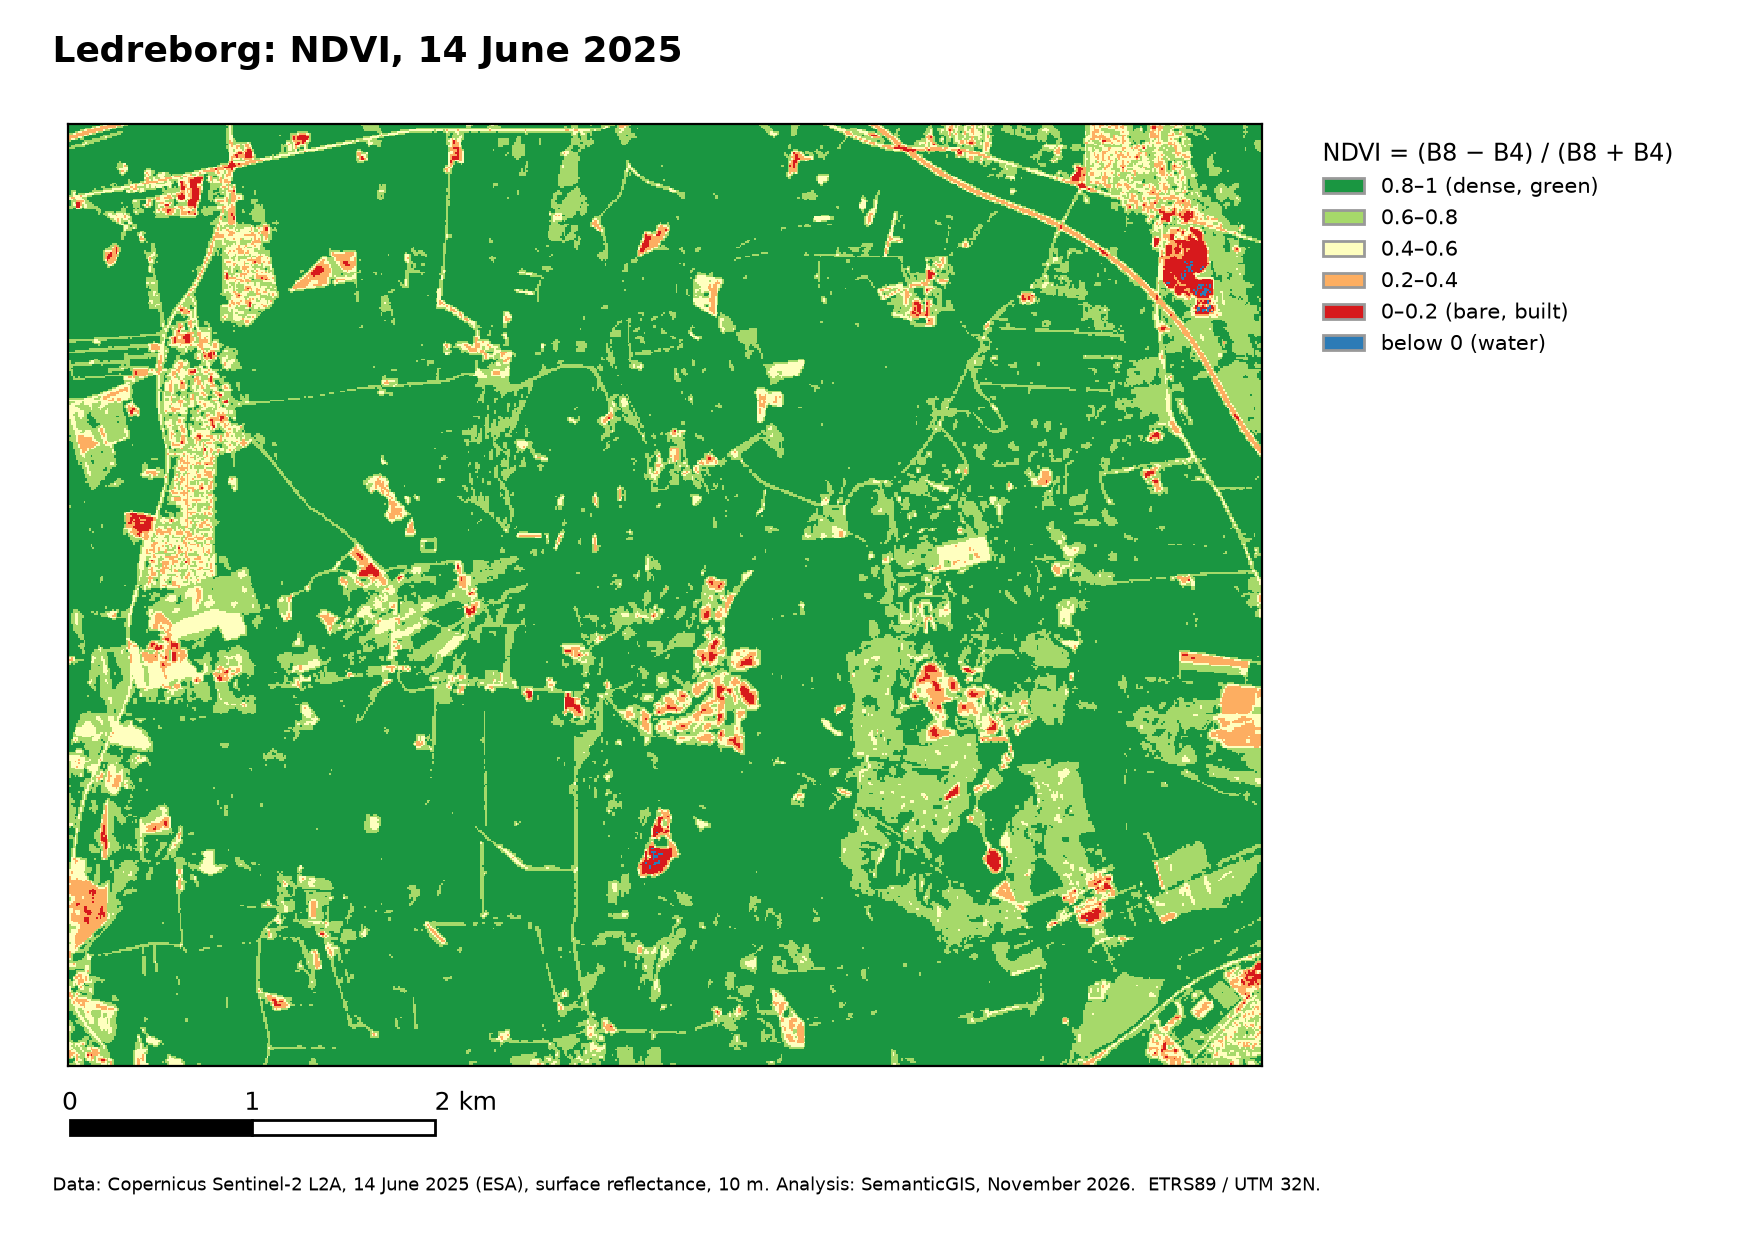
| Cells (10 m) | 356,160 |
| Mean / median NDVI | 0.81 / 0.87 |
| Above 0.8 | 74 % |
| 0.6–0.8 | 18 % |
| Below 0.2 | 0.7 % |
| Masked (dark, unclassified) | 696 cells, 0.2 % |
NDVI per land use
| Land use (Basemap04) | Area (ha) | Mean | Median | 10th–90th percentile |
|---|---|---|---|---|
| Forest | 615 | 0.90 | 0.91 | 0.85–0.93 |
| Stream | 20 | 0.89 | 0.90 | 0.85–0.93 |
| Nature, wet | 106 | 0.87 | 0.88 | 0.83–0.91 |
| Agriculture, intensive, temporary crops | 1,624 | 0.85 | 0.87 | 0.76–0.92 |
| Agriculture, extensive | 415 | 0.76 | 0.81 | 0.51–0.89 |
| Lake | 85 | 0.73 | 0.80 | 0.45–0.89 |
| Low built up | 166 | 0.66 | 0.69 | 0.40–0.86 |
| Road, paved | 95 | 0.54 | 0.55 | 0.28–0.77 |
- Saturation. Forest, wet nature and intensive fields all lie between 0.85 and 0.90. NDVI says they are all dense and green on 14 June; it does not tell them apart. The colour-infrared image, an image from another month, or the red-edge and SWIR bands would.
- Spread within a class. Intensive fields range from 0.76 to 0.92 (10th–90th percentile): crops at different stages, and some fields with bare soil showing. Extensively farmed land spreads further (0.51–0.89).
- Mixed pixels. Streams have the NDVI of forest: they are narrower than a pixel, so their pixels show mainly the vegetation along them. Paved roads average 0.54, not near 0, because a 10 m pixel on a road also covers verges and hedges. Lakes average 0.73: most are small, so many of their pixels include the vegetation around them.
- Built-up areas spread from 0.40 to 0.86: roofs and paving against gardens and street trees.